
Why numbers alone will never tell you the whole story of a match

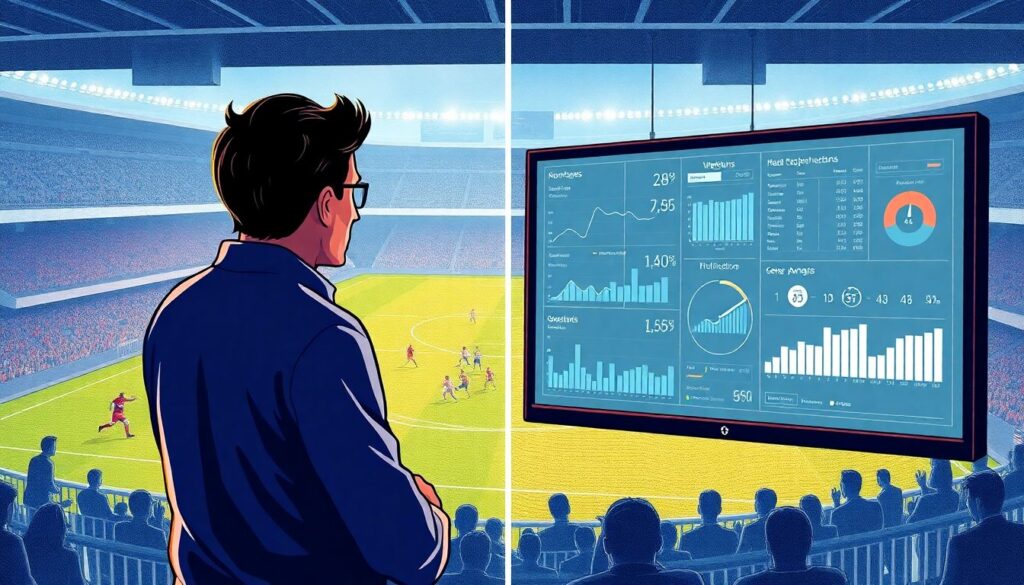
Modern football lives obsessed with data. We have xG, PPDA, packing, possession value models, tracking data, you name it. That’s great. But if you lean only on spreadsheets, you’ll end up doing *análisis de partidos con estadísticas deportivas avanzadas* that sound smart and miss how the game actually felt and unfolded.
This article is about using data and statistics as powerful lenses without letting them replace your eyes, your football brain and your understanding of context. Think of it as a guide to blending human insight with numbers so you don’t turn analysis into a math exercise detached from the pitch.
—
Key concepts: talking the same language before talking about data
What we really mean by “data” in football
In football analysis, *data* is every piece of information that can be captured about a match or a player and structured so we can compare it: passes, distances, accelerations, body orientation, pressing zones, even emotional signals if you track them consistently.
Three big families:
– Event data: Discrete actions – passes, shots, tackles, interceptions, carries, crosses.
– Tracking data: Positions of players and ball at very high frequency (e.g., 25 frames per second).
– Contextual data: Match state (0–0, 1–0), fatigue, weather, travel, tactical plan, psychological factors.
Most people obsess over the first two and barely code the third. That’s a mistake. Context is where the human eye usually wins.
What is “advanced statistics” really measuring?
*Advanced statistics* are just math models built on top of raw data to approximate things we can’t see directly:
– Expected Goals (xG): Probability that a shot becomes a goal, given location, body part, angle, pressure, etc.
– Expected Threat / Possession Value: How much a pass or carry increases the chance of scoring in the near future.
– Pressing metrics (PPDA, high regains): Intensity and efficiency of pressure.
– Sequence/possession metrics: How your team creates and progresses attacks.
None of these are “truth”. They’re *estimations* of tendencies. Treat them like a compass, not a GPS.
—
Diagramming a match: how to “draw” data without losing the game
Simple mental diagrams you can use while watching
You don’t need fancy visuals to think visually. Here are three text-based “diagrams” you can imagine or sketch in a notebook.
1. Zone heat sketch
Imagine dividing the pitch into a 3×3 grid:
– Left / Centre / Right
– Defensive third / Middle third / Final third
Now describe ball presence in words:
> “First half, our heat is:
> [D-third]: mostly left and centre
> [Mid-third]: heavy in centre, light wide
> [Final third]: right-heavy, almost no presence in left half-space.”
You’ve just built a rough heatmap that helps explain why your left winger looked invisible. No chart needed, just structured observation supported later by touch maps and progressive passes from data.
2. Verticality vs control axis
Sketch a horizontal line in your mind:
– Left end: “Slow, combinational, low risk”
– Right end: “Direct, vertical, high risk”
Now, for each 10–15-minute phase, place the team somewhere on that line, then check:
– Does the pass length distribution from the data match what you felt?
– Do field tilt and entries into final third agree with your impression of dominance?
3. Pressing intensity timeline
Picture the match as a line from minute 0 to 90. Mark three zones:
– 0–30: High press
– 31–60: Mixed, conditional press
– 61–90: Block lower, conserve energy
Later, compare this mental sketch with:
– PPDA by segment
– Number of high turnovers
– Distance from own goal at defensive actions
The “diagram” checks if your intuition about when the team dropped off matches the numbers.
—
Where data shines… and where the human eye still dominates
What data is excellent at
Data is a beast at things our memory and intuition are bad at:
– Volume and repetition: Detecting long-term patterns across dozens of games.
– Bias reduction: Correcting “I remember the spectacular action and forget the 20 boring but important ones”.
– Precision: Exactly how many times the team entered the box vs “I feel like we didn’t attack much”.
That’s why the *mejores herramientas de big data para análisis de partidos de fútbol* have taken over elite clubs: they compress thousands of events into a few meaningful patterns a human can digest.
What human analysis is still better at
But there are areas where the human eye, plus football knowledge, still wins:
– Intent: Was a pass backwards a cowardly choice or a tactical reset under pressure?
– Emotional load: Fear, bravado, frustration – you see them in body language, not spreadsheets.
– Micro-adjustments: A full-back narrowing two meters to block a lane that never becomes a “defensive action”.
This is why a purely automated *software de análisis de fútbol con datos y vídeo táctico* is incredibly powerful but still incomplete without a coach, analyst or scout interpreting the “why” behind the “what”.
—
Expert framework: four steps to mix data and context
Step 1 – Watch once with no numbers, only questions
Several professional analysts recommend a strict routine:
1. First viewing: no dashboards, no stats. Just watch and write questions.
2. Second viewing: watch with data, answering and refining those questions.
Sample questions from pros:
– “Why did we stop progressing down the right after minute 60?”
– “Was the number 6 really overrun or just isolated tactically?”
– “Did the press fail, or did we stop pressing?”
By starting with questions, you force data to serve your analysis, not dictate it.
Step 2 – Define your key indicators before kick-off
Pick a handful of metrics that reflect the game model and the match plan:
– For a high press team: high turnovers, PPDA, defensive line height.
– For a possession team: progression into final third, central overloads, passes into half-spaces.
– For a direct team: deep runs, second-ball recoveries, xG from fast attacks.
An expert tip: write these on the game plan sheet before the match. After, you’ll check them against what happened, instead of cherry-picking pretty numbers.
Step 3 – Use numbers to challenge what you “felt”
Example:
– You “felt” your team dominated.
– Data says: 65% possession, but only 0.7 xG, and most possession in your own half.
Interpretation:
– You had the ball, but not control near the opponent’s box.
– The opponent let you circulate safely and defended the important zones.
Here data corrects a classic bias: equating possession with dominance.
Another example:
– You thought a striker was invisible.
– Data shows: few touches, but 9 high-intensity runs dragging the line back and opening space.
Conclusion: his impact was mostly off the ball; your eye focused on touches, not movements. Data helps unveil invisible work.
Step 4 – Annotate context directly into your databases or notes
Top analysts don’t just log events. They annotate context like:
– “Minute 55: temp drops, heavy rain, pace slows.”
– “Minute 63: tactical change, 4-3-3 → 4-2-3-1.”
– “Minute 76: visible fatigue in wide players, more late presses.”
Even if you’re not in a club, do this in your own notes. Later, when you see that xG dropped after minute 60, you can link it to tactical shifts or fatigue instead of inventing theories.
—
Comparing tools: spreadsheets, software and human conversations
From manual notebooks to integrated platforms
You can do serious work with:
– A simple notepad and a stopwatch.
– A spreadsheet with basic formulas and filters.
– Modern video tools with built-in stats and tagging.
Where *software de análisis de fútbol con datos y vídeo táctico* truly outperforms DIY methods is:
– Synchronization: instantly jumping from a data filter (all high regains) to the exact clips.
– Speed: cutting analysis time from hours to minutes.
– Scale: handling whole seasons and multiple leagues efficiently.
But there’s a trade-off: the more polished the interface, the higher the temptation to “trust the dashboard” instead of asking if the metrics actually map to your game idea.
Why human debriefs still matter more than any dashboard
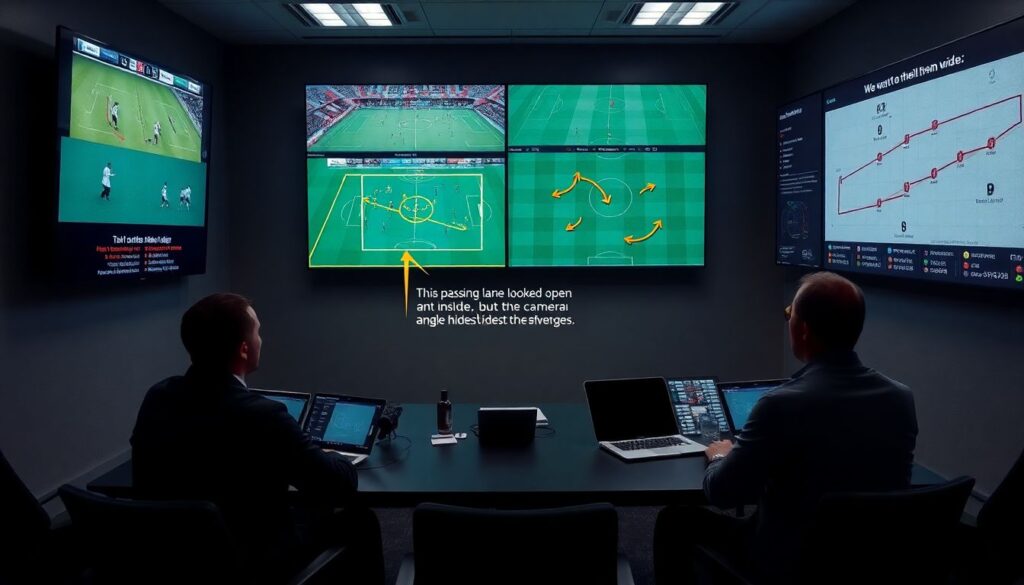
Even in clubs with the strongest *servicios profesionales de scouting y análisis de datos en fútbol*, post-match debriefs usually include:
– Player feedback: “This passing lane looked open from inside, but the camera angle hides the defender.”
– Coaching perspective: “We *wanted* to funnel them wide, so their crosses are not necessarily a failure of our block.”
– Analyst perspective: “Yes, we shot often, but mostly from low-value areas.”
These conversations are where numbers, video, and lived experience merge. Without them, even the best tools are underused.
—
Expert recommendations: how pros keep the “human layer” alive
1. Start every report with a narrative, not with a chart
Many analysts in top clubs structure their reports like this:
1. 1-page narrative: What happened and why, in plain language.
2. Key clips: 8–15 video clips supporting the narrative.
3. Core metrics: Only after that, carefully chosen numbers.
Numbers validate and refine the story; they don’t replace it.
2. Always answer “for whom” and “for what”
An expert exercise: before building any dashboard or report, write:
– Who is this for? Head coach, assistant, scouts, players, directors?
– What decision needs to be taken? Training focus, selection, recruitment, tactical tweak?
For example, recruitment scouts using *servicios profesionales de scouting y análisis de datos en fútbol* need profiles over long horizons, not only one game. Match analysts need game-specific tendencies. Same data source, different filters and stories.
3. Limit yourself to 3–5 metrics per phase
To avoid drowning in stats, several pros impose a strict limit, for example:
– Out of possession: PPDA, high regains, defensive line height, passes allowed to key 10.
– In possession: xG, box entries, central progression, final-third turnovers.
When you limit metrics, you’re forced to pick those that best express your model of play. This is a safeguard against “metric shopping”.
4. Train your eye like you train your code
Analysts often invest in a *curso online de análisis de datos aplicados al fútbol profesional*, which is smart. But top experts stress doing parallel work:
– Watch full matches at 1.25x speed focusing only on one line (defence, midfield, attack).
– Do “no-ball viewing”: look away from the ball and watch only the weak side.
– After watching, write a “no-data report”, then compare with the post-match stats.
This dual training keeps your football eye sharp so you can interpret data instead of just reading it.
—
Common traps and how to avoid them
Trap 1 – Confusing correlation with causality
Example:
– “When we press high, we win more matches.”
– Maybe. Or maybe you press high in matches where you’re already superior and confident.
Fix:
– Check opponent quality, home/away, schedule congestion.
– Tag matches by match plan, not only by outcome.
Trap 2 – Overreacting to single-match metrics
One game is noisy:
– A player can run little because the team has the ball most of the time.
– A low xG game can still be tactically excellent if your plan was to neutralize and not to dominate.
Fix:
– Look at trends over 5–10 matches, not isolated values.
– Combine: single-match deep dive + rolling averages.
Trap 3 – Building models that ignore your coach’s language
If your head coach talks about “compactness, distances, timing”, and your outputs are only “xThreat and packing”, you’ve already lost.
Expert tip:
– Translate: define how “compactness” is *measured* in your context (distance between lines, distance between units, area occupied).
– Then, express that in your reports: “We were 5–7 meters wider than our compactness standard in the last 20 minutes.”
—
When big data really changes your decisions (and when it shouldn’t)
Recruitment and opponent analysis: where data has the highest leverage
The *mejores herramientas de big data para análisis de partidos de fútbol* show their full power in:
– Recruitment: Finding players in secondary leagues whose profiles fit your style, before they become expensive.
– Opponent scouting: Detecting stable tendencies over many matches (build-up zones, press triggers, set-piece patterns).
Here, your human eye simply cannot watch enough football; machines fill the gap. But the *final* decision – “Are we signing this player?” or “Do we change our defensive structure?” – is still heavily based on contextual understanding, video, and alignment with your game model.
In-match decisions: where feel and communication still rule
During the game, live data can help:
– Spot fatigue earlier.
– Confirm that a press has really dropped, not just “feels” weaker.
– Detect that your right side is overloaded.
But experts insist: in-match, data should be minimal and actionable. Two or three key live indicators, max. The rest is for half-time and post-match.
—
Practical workflow: a balanced 24–48h post-match routine
Within 2 hours after the match
– Quick rewatch of key phases (10–15 fast clips).
– Short narrative: 5–10 bullet points of “what really happened”.
– First emotional check: does the narrative come from frustration/joy or from actual events?
Next day
– Pull core stats: xG, box entries, high regains, progression, pressing metrics.
– Compare numbers with narrative; adjust where needed.
– Prepare 8–12 clips that best explain the main points.
Before team meeting
– Translate analysis into simple, football language.
– Show players: clips first, then numbers, and always explain “why this matters for our model”.
– End with 2–3 clear, training-oriented takeaways.
This workflow makes sure stats never replace the game itself – they sharpen and clarify it.
—
Final thought: using data to see more, not to feel less
Data and advanced stats in football are not the enemy of “pure football people”. They’re tools to:
– Remember what really happened, not just what was spectacular.
– Discover patterns your eyes alone would miss.
– Communicate more clearly what you see and what you want to improve.
If you put human observation, context, and football logic first – and then make data work in service of that – your análisis de partidos con estadísticas deportivas avanzadas becomes richer, not colder. You don’t lose the human vision of the game; you stretch it.